A structured thinking is required to solve problems and to conduct deep analysis. Without hard parameters, it is difficult to manage scope of the problem and create actionable steps.
Frameworks are not immediately applicable to the real world because the real world doesn't share all the assumptions and parameters.
All frameworks have complementary weaknesses. And vice versa. It is wise to use caution to stay adaptable while using frameworks. A few frameworks I often use in my day of managing products.
Decision-making
| Framework | Description |
|---|---|
| S.P.A.D.E | A decision-making framework to help synchronize and speed up collaboration to make difficult choices. An acronym for Setting, People, Alternatives, Decide and Explain. |
| Eisenhower Matrix | The Eisenhower box includes one axis that is important, the other axis is urgent. It is a two by two matrix to help with prioritization. |
| Objective Key Results (OKR) | OKR is a goal setting framework that was popularized in Silicon Valley. It stands for Objective and Key Results. Objective answers the WHAT is to be achieved. Key Results answers the HOW is it going to be achieved. |
| Now Next Later | The Now-Next-Later roadmap is a product management tool that organizes work into three-time horizons, from immediate to long term, starting with the most urgent problems to solve. |
| One-way & Two-way Decisions | One-way door decisions have lasting effects and are often hard to reverse. Conversely, two-way door decisions are reversible and less impactful. They provide opportunities to experiment, learn, and iterate. |
| 3Ds | A tactical decision-making framework by Annie Duke who is a decision-making expert. The 3 Ds are— discover, discuss and decide. |
S.P.A.D.E
Consensus doesn't work and when time comes to make hard decisions, there should be a person in-charge of it. So how do you do that? S.P.A.D.E—a technique for making difficult decisions—formed by Gokul Rajaram at Google and Facebook, and widely deployed at Square.
- S is for Setting: Precisely define the “what.” Show the why of the “when.” Clarify the “why.”
- P is for People: People come first. The first thing you do for every S.P.A.D.E. is identify the people who should consult (give input), approve, and most importantly, a single person who is responsible. Responsible means accountable. Consult maximally.
- A is for Alternatives: It’s the job of the responsible person—the decision maker—to come up with a set of alternatives that are feasible and realistic; diverse—they should not all be micro-variants of the same situation; and comprehensive—they should maximally cover the problem space. Brainstorm publicly.
- D is for Decide: Once you've laid out all the alternatives—complete with their respective pros and cons and quantitative modelーit is time to get your consultants to vote. Get feedback privately.
- E is for Explain: Once you've decided, now the real work begins. Go to the approver and lay out the alternatives and your argument. If you created a high-quality decision framework, they're unlikely to veto it. Call a commitment meeting. Broadcast your decision. Add it to the S.P.A.D.E. log. Keep a log that links to your S.P.A.D.E. and marks the date of the decision. It will be much easier than relying on Gmail search or Slack when you want to reference or amend a past decision.
Further reading
Eisenhower Matrix
A decision-making framework designed and named after the 34th President of the United States of America—Dwight Eisenhower. He launched one of the most successful programs that are critical to our society today—highways, space exploration, internet (DARPA) and energy alternatives. He accomplished a ton! How did he do it?
The Eisenhower box includes one axis that is important, the other axis is urgent. You put each task in one of the four quadrants:
- Urgent and important: tasks you will do immediately
- Important, but not urgent: tasks you will schedule to do later
- Urgent, but not important: tasks you will delegate to someone else
- Neither urgent nor important: tasks that you will delete
The most important quadrant is the last one because it challenges me to question whether an action is really necessary. Mindlessly doing something is lazy thinking and procrastinating.
It isn't perfect because urgent can mean different things to different people. But it is intuitive and adaptive framework to help with prioritization.
What is important is seldom urgent and what is urgent is seldom important. — Dwight Eisenhower
Further reading
Objective Key Results (OKR)
Objective Key Results (OKR)—a goal setting framework that was popularized in Silicon Valley has been widely adopted beyond the West Coast. OKR has been a better part of my professional journey, but the implementation of the methodology has always been messy because they do not cascade through the entire organization as they are intended to.
This led me to study the topic from the father of OKR who came up with the methodology—John Doer.
A lot of companies create organization-wide objectives, but they don’t translate them down into personal OKRs. That’s right — and creating that cascade is one of the powerful parts of the system. The book says that there are four superpowers. On reflection, I think there are really five benefits that you get out of this. Focus is the first, because these are limited in number. Alignment is the one you’re talking about — you get everybody aligned. Commitment is third. When you’ve transparently set these goals, and all your colleagues see them, commitment clears that up quickly. And then the fourth superpower is tracking the progress. This is why Bill Gates uses the system at the Gates Foundation. Then the fifth superpower is stretching. Larry Page of Google is the high priest of 10x-ing everything, stretching further. He’ll say, I’d rather have the objective be to go to Mars, and if we fall short, we’ll get to the moon. This is how you make moonshots. Focus, alignment, commitment, tracking and stretching, I love that because it spells FACTS. And I can remember it. How do OKRs differ from, or complement, an Agile system? Agile guides your day-to-day work. OKRs don’t govern your day-to-day behavior. I’d say this is more of a weekly check-in. But it’s not set the goals and then stuff them away in a drawer and ignore them. People really care whether or not the CEO is watching their goals or cheering them on. If a leader wants a way to reach down into an organization, this is a great tool for doing it. You even use OKRs in your personal life? Yes, it can work against any agenda. I have had a set of personal objectives and key results. Most of mine have been around family. Now both daughters are off to school, but years ago I read and believed that having family dinners together was a key to having a happy family. So my key result was to get home for dinner by 6PM at least 20 nights a month, and be present, with our phones in another room. And that’s pretty hard to do. I was living in the 70% threshold is a good result — that would mean 14 or 15 nights a month. That’s an example of how OKRs can span any range of human activity. They’re transparent vessels that describe the “what” and the “how.” The values we pour into those vessels are the answers for the question, “Why?” — John Doer
If implemented right, OKRs can drive 5 things—focus, alignment, commitment, tracking progress and stretching (FACTS).
OKRs are not perfect. In the absence of strong leadership or the absence of a visionary leader, the entire organization could be working on wrong things if objectives are not bold enough for the business. OKRs also do not allow for what isn't under your control. Self-worth is tied into objective and key results, but the individual does not have full control over its environment. Though Doerr argues against tying performance into key results, but hardly seen this in practical world. A system is equally responsible for failure to meet its objective.
Nonetheless, OKRs are valuable in driving focus for the entire organization and measure progress against set objectives.
Background
John Doerr is the father of OKR who is responsible for bringing OKRs to Google and the world. He transformed Andy Grove's managerial system from Intel and made the process formal through OKR. Andy Grove was best known for driving operational excellence at Intel during its peak. Following were Grove's managerial philosophy:
- Less is more–each objective should be tied to no more than five key results.
- Set goals from the bottom up—team members are motivated when individuals set their own OKRs.
- No dictating—OKRs are “a cooperative social contract,” so there should always be space for debating and negotiations.
- Stay flexible–in a fast changing environment, objectives can stop being relevant, so it should always be easy to modify them, together with the key results.
- Dare to fail—some OKRs should be uncomfortable, even unattainable, which means you’d need to be ready to fail.
- A tool, not a weapon—OKRs are not legal documents according to which you’re expected to measure your performance.
- Be patient—it’s next to impossible to fully understand the mechanism of the system in one cycle (1 quarter); five quarterly cycles should be enough to see how the goals actually perform.
Definition
OKR is short for Objective and Key Results. Both are collaboratively driven by an entire organization to execute on the vision and strategic goals.
- Objective: answers the WHAT is to be achieved.
- Key Results: answers the HOW is it going to be achieved.
If implemented correctly, it drives focus and transparency while eliminating conflicting priorities.
An illustrative example of OKRs in an organization:
CEO
- Objective: gain ice-cream market share in Chicago.
- Key Results: sell 5000 pallets of vanilla ice-cream a week in neighborhoods with large population.
Head of Manufacturing
- Objective: produce 5000 pallets of vanilla ice-cream a week.
- Key Result: make 150,000 gallons of vanilla ice-cream a week.
Head of Sales
- Objective: sell 5000 pallets of vanilla ice-cream a week.
- Key Result 1: create a referral program to achieve >90% brand recommendation from existing buyers.
- Key Result 2: create a brand promotion with summer camp organizations to sell ice-cream during game days.
This is simple, but an illustrative example of OKR in action. It ties back into CEO's objective which cascades down to every business unit.
The secret sauce of OKRs is in the Key Results.
Performance should be measured by results (note, not tied to employee compensation). Each key result is measurable and verifiable. This is the best way to align incentives. Results should be regularly updated every quarter. If results are not achieved within a defined timeframe, it is time to reassess.
A key point to remember—progress should be measured by outcome not an output otherwise goals are up for gamification. For example, Wells Fargo's organizational goals led personal bankers to open fake customer accounts to meet the quota. The goals backfired and took Wells Fargo into compliance trouble. Key results should be set intentional to ensure they cannot be tricked.
Lastly, the goal is not to create a feature factory machine, but to solve a business problem and create organizational value. If organization is structured and aligned correctly, OKRs can be extremely effective by ensuring all members of the organization are working toward the same goals.
OKR superpowers
The 5 superpowers of OKRs—focus, alignment, commitment, tracking progress and stretching.
- Focus—the organization on what matters for the company to survive and function.
- Align—OKRs to individual goals and the company’s game plan. Identify cross-team dependencies that require collaboration. For sound decision-making, and superior performance, top-line goals must be clearly understood throughout the organization and shared throughout the entire organization.
- Commit—to goals 100% which are supposed to be achieved within a specific time limit.
- Track for accountability—OKRs are driven by data and require periodic check-ins for objective grading, done in a spirit of no-judgment accountability. Google scores on 0 to 1.0 system:
- 0.7 to 1.0 is green
- 0.4 to 0.6 is yellow
- 0.0 to 0.3 is red
- Stretch your goals—aspirational objectives are those that go beyond your everyday routine and are more about your vision of the company’s future. They are not always attainable, but necessary for management and contributors to challenge themselves.
If companies don’t continue to innovate, they’re going to die—and I didn’t say iterate, I said innovate. — Bill Campbell
Continuous performance management
Feedback is an opinion, grounded in observations and experiences, which allows us to know what impression we make on others. — Sheryl Sandberg
OKRs set the context for Continuous Performance Management (CFR). CFRs help promote transparency, accountability, empowerment, and teamwork.
- Conversations—an authentic, richly textured exchange between manager and individual contributor aimed at driving performance.
- Feedback—bidirectional or networked communication among peers to evaluate progress and guide future improvement. For example, “We are constantly surrounded by positive reinforcement and feedback, but many of us haven’t been trained to seek it out. Say you give a presentation to your team. After the fact, somebody comes up to you and says, ‘Hey, nice job.’ Most of us would say, ‘Oh great, thanks,’ and move on. But we want to probe a little deeper: ‘Thank you. What one thing did you like about it?’ The idea is to capture more specific feedback in real time.”
- Recognition—expressions of appreciation to deserving individuals for contributions of all sizes.
Relationship between OKRs and culture
Culture eats strategy for breakfast. OKRs are the raw ingredients to make that breakfast.
Culture is a set of values and beliefs, as well as familiarity with the way things are done and should be done in a company. The point is that a strong and positive corporate culture is absolutely essential. — Andy Grove
A culture that drives focus, alignment and meaning will always win. If an organization believes the work they are doing, members of the organization will feel empowered and motivated to show up. OKRs should be set in a way that answer the following:
- Structure and clarity—are goals, roles, and execution plans on our team clear?
- Psychological safety—can we take risks on this team without feeling insecure or embarrassed?
- Meaning of work—are we working on something that is personally important for each of us?
- Dependability—can we count on each other to do high-quality work on time?
- Impact of work—do we fundamentally believe that the work we are doing matters?
Further reading
Now Next Later
This is one of the best frameworks for roadmapping and planning. It accounts for simplicity (KISS-keep it simple), flexibility and easier to follow. Roadmaps often face disruption for some unforeseen reason. The Now-Next-Later roadmap is a product management tool that organizes work into three-time horizons, from immediate to long term, starting with the most urgent problems to solve. This roadmap format conveys the overall product vision, as each element of work is tied back to a business objective.
- Now-Next-Later framework:
- The Now column contains the initiatives that you are working on, well, now. Requirements are clear.
- The Next column is what will happen once everything in the Now column is complete. Requirements are less refined.
- The Later column is everything else you’ve proposed doing, but it won’t happen until sometime in the undefined future. Requirements are hazy.
- Ask the following to categorize your feature set or solutions:
- Is the problem large?
- Is the problem urgent?
- Is the problem valuable?
One-way & Two-way Decisions
With a one-way door decision, the idea is that, when we make the decision, we walk through the door. Upon entering the space on the other side of the door, we are able to see the consequences of our decisions. Unfortunately, because it’s a one-way door, if we don’t like what we see, we can’t turn around and walk out through the door again. This is what Bezos calls a “Level 1 decision.” For these types of decisions, we want to be cautious, data-driven, and deliberate in our decision-making.
With a two-way door decision, on the other hand, when we walk through the door, if we don’t like what we see, we get to turn around and undo our decision. This is what Bezos calls a “Level 2 decision.” He suggests that, with a two-way door decision, we’ll learn more by acting—walking through the door and seeing what’s on the other side—than we would by trying to imagine what’s on the other side of the door.
Jeff Bezos, founder and CEO of Amazon, made this exact argument in his 2015 letter to shareholders,33 where he introduced the idea of Level 1 and Level 2 decisions. He describes a Level 1 decision as one that is hard to reverse, whereas a Level 2 decision is one that is easy to reverse. Bezos argues that we should be slow and cautious when making Level 1 decisions, but that we should move fast and not wait for perfect data when making Level 2 decisions.
You need people to be ambitious, technically ambitious, “If there are five ways to do something, we’ll study them, but let’s study them very quickly and make a decision.” We can always change our mind. Changing your mind, I talk about one-way doors and two-way doors, most decisions are two-way doors. If you make the wrong decision, if it’s a two-way door decision, you pick a door, you walk out and you spend a little time there. It turns out to be the wrong decision, you can come back in and pick another door. Some decisions are so consequential and so important and so hard to reverse that they really are one-way door decisions. You go in that door, you’re not coming back. And those decisions have to be made very deliberately, very carefully. If you can think of yet another way to analyze the decision, you should slow down and do that. So when I was CEO of Amazon, I often found myself in the position of being the chief slow down officer because somebody would be bringing me a one-way door decision and I would say, “Okay, I can think of three more ways to analyze that. So let’s go do that because we are not going to be able to reverse this one easily. Maybe you can reverse it if it’s going to be very costly and very time-consuming. We really have to get this one right from the beginning.” And what happens, unfortunately, in companies, what can happen, is that you have a one-size-fits-all decision-making process where you end up using the heavyweight process on all decisions. Two-way door decisions should mostly be made by single individuals or by very small teams deep in the organization. And one-way door decisions are the irreversible ones. Those are the ones that should be elevated up to the senior-most executives who should slow them down and make sure that the right thing is being done. Changing the decision is going to be very, very complicated. Some of them are technical decisions too because some technical decisions are like quick-drying cement. Once you make them, it gets really hard. Choosing which propellants to use in a vehicle, selecting LNG for the booster stage and selecting hydrogen for the upper stage, that has turned out to be a very good decision. But if you changed your mind, that would be a very big setback. So that’s the kind of decision you scrutinize very, very carefully. Other things just aren’t like that. Most decisions are not that way. Most decisions should be made by single individuals and done quickly in the full understanding that you can always change your mind. I’m here and I could say, “Lex, how tall do you think this ceiling is?” And you’d be like, “I don’t know, Jeff, maybe 12 feet tall.” And I would say, “I think it’s 11 feet tall.” And then we’d say, “You know what? Let’s just call it 11 and a half feet.” That’s compromise, instead of. The right thing to do is to get a tape measure or figure out some way of actually measuring, but think getting that tape measure and figure out how to get it to the top of the ceiling and all these things, that requires energy. Compromise, the advantage of compromise as a resolution mechanism is that it’s low energy, but it doesn’t lead to truth. And so in things like the height of the ceiling where truth is a noble thing, you shouldn’t allow compromise to be used when you can know the truth. — Jeff Bezos/Lex Fridman
3Ds
Annie Duke is a decision-making expert, former professional poker player, special partner at First Round Capital, and the author of Thinking in Bets (a national bestseller) and Quit: The Power of Knowing When to Walk Away. She also co-founded Alliance for Decision Education, a nonprofit whose mission is to improve lives by empowering students through decision skills education. Use the “3Ds” framework to make better decisions for your org. More can be found on Lenny's Podcast.
- Discover: Collect individual opinions independently before group discussion and then share these with everybody prior to the meeting.
- Discuss: Compare perspectives within the group, focusing on understanding points of disagreement rather than building consensus.
- Decide: Make decisions independently post-discussion to minimize group influence.
Other tips from Annie Duke:
- Incorporate the word “nevertheless” into discussions, especially when making decisions or addressing disagreements. It acknowledges the other person’s perspective while affirming your decision or stance.
- Replace confrontational language like “I disagree” or “you’re wrong” with phrases like “I don’t understand” so everyone feels heard and valued. If people feel heard, they are more likely to feel like they contributed to the decision, even when they disagree.
- Use pre-mortems to set kill criteria. Before starting a project, imagine failure and what early warning signs might have predicted it. Commit in advance to reassess or pivot if you notice those red flags later on. This makes it easier to walk away when sunk costs and overconfidence bias loom large.
Product design & discovery
| Framework | Description |
|---|---|
| Domain Model | It is about the practice of software design which puts domain users, its behavior and problems first. It is driven by business logic. Domain is the problem domain, and the Model is the model of the problem. |
| Jobs To Be Done (JTBD) | A theory of innovation that is based on the economic principle that people buy products and services to get “jobs” done, i.e., to help them accomplish tasks, achieve goals and objectives, resolve and avoid problems, and to make progress in their lives. |
| Continuous Discovery | Teresa’s Torres authored Continuous Discovery Habits, which is her continuous discovery framework for building better products that are guided by user feedback. |
Domain Model
Recent encounters on my current team has led to several discussions on whether a feature has a bug or whether it was poorly designed.
A bug is when a feature in not functioning the way it is expected to.
A feature gap is a gap in the system due to a miss during initial design.
Who is to be blamed for this—business, engineering or design? It depends!
Based on the two statements above, if it is a bug, engineering came short on executing requirements. If it is a feature gap, both engineering and design didn't get enough requirements from product. Product didn't think through the requirements. Lastly, neither product nor engineering control reality as business dynamics are always changing. This would require enhancing feature based on new rules.
In software development, incorrect relationships determines the amount of complexity. Features collapse under the weight of its own complexity. Context is everything. Domain driven design can avoid much of this trouble to ensure context is captured before any line of code is written.
However, there should be room for randomness and moving parts because reality is not static. Business requirements can change because there is a new CEO or due to new industry-wide regulations.
A solution model will always need to be adjusted over time and refined into a better representation of reality. Skilled engineers are always refactoring. And, skilled product managers are always communicating what is coming next.
Learning about your domain, writing it down and driving consistency on terminologies have clear communication benefits. If product managers are domain experts then they should work with engineering and design teams to formalize shared understanding on domain.
One of the miseries of life is that everyone names everything a litle bit wrong, and so it makes everything a little harder to understand in the world than it would be if it were named differently. A computer does not primarily compute in the sense of doing arithmetic. Strange. Although they call them computers, that's not what they primarily do. They primarily are filing systems. People in the computer business say they're not really computers, they are "data handlers". All right. That's nice. Data handlers would have been a better name because it gives a better idea of the idea of a filing system. — Richard Feynman
Domain model
The concept of Domain Models come from Domain Driven Design (DDD) which is a software design approach.
At its core, domain model is about the practice of software design which puts domain users, its behavior and problems first. There are no technical considerations as this is purely driven by business logic. The basic idea is that the Domain is the problem domain, and the Model is the model of the problem.
It is a system of abstraction. Product managers should be well-equipped to understand this business context and be able to communicate to the teams.
The domain model has the following elements:
- Domain Objects: Entities with an ID which can be indexed
- Values: A property value wrapped in a class
- Aggregates: A group of related Entities
These elements represent the domain (business logic) in which the problem is solved. In a domain model, you model objects and draw associations between them so that you have high level idea on how the system will work and how they will interact with each other.
Let's take a look at an example. Imagine you are building a research product and an analyst is searching for a company to invest in $10 million. This analyst is looking for insights on a research platform to conduct the due-diligence. As you build a research product for this analyst, you want to consider the following:
- Who is your target customer? And who are your customer types? It could be an investor. Investor can be broken down into a retail investor, institutional investor or a venture investor. There can of course be different type of customers—investor, analyst, media analyst, etc., but we'll focus on the analyst for this example.
- What is the job to be done and workflows? A venture investor wants to learn about new technologies. A retail investor wants to learn about the balance sheet health of a company. An institutional investor wants to find the best in class company within energy sector for its pension portfolio.
- What are the domains (entities) they interact with? There are several—companies, industries, sectors, topics, competitors, events, SEC filings and expert interviews.
- What is the relationship between these domains? How do they behave with each other? Is it a one-on-one or many relationships? Is there an overlap between multiple domains? Investor might want to learn about an industry landscape and how the players stack against each other to compete against one another.
Thinking through a customer's point-of-view to design a solution can be highly effective for the entire team. To summarize why domain models are critical for product managers:
- The domain model is a representation of real-world concepts including the data involved in the business and rules the business uses in relation to that data. The domain model is organized and structured knowledge of the problem.
- Every system (or product) has people, things, and relationships between things and people along with workflows.
- Domain model is a conceptual schema or a map of concepts and their relationships.
- Domain models are richer than simple data models as they capture the behavior and domain logic.
- It is a visual representation of situation objects in a domain. The term domain model does not mean a set of diagrams describing software classes. Domain model can be represented by a diagram, code example or written documentation of the problem.
- The important thing is that the domain model should be accessible and understandable by everyone who is involved with the project. One of the downfalls of software development projects is the misunderstanding of terms, objectives and proposed solutions that are scoped at the beginning of development.
- In software, a domain model is a conceptual model of the domain that incorporates both behavior and data. This is critical for PMs to pay attention to because they are responsible for driving requirements. And requirements cannot be defined without understanding the core behavior and data of a domain. There are plenty of what ifs and buts for PM to help answer.
- A domain model is implemented as an object model within a layer that uses a lower-level layer for persistence and publishes an API to a higher-level layer to gain access to the data and behavior of the model. An object model consists of the following important features—object reference, interface (API or UI), actions and exception handling to account for various errors and warnings.
Further reading
Jobs To Be Done (JTBD)
A theory of innovation that is based on the economic principle that people buy products and services to get “jobs” done, i.e., to help them accomplish tasks, achieve goals and objectives, resolve and avoid problems, and to make progress in their lives. In order to succeed in implementing this framework, work to gain a deep understanding of those jobs, and then create offerings that will help customers get their jobs done significantly better and/or more cheaply.
- The whole premise of JTBD is that people hire products, they don't buy them, they hire them to make progress in their life.
- The primary cause of failed products and services is a misalignment with customer needs. Using the JTBD framework product teams can deeply understand the jobs its customers are trying to get done and the metrics they use to measure success. It can help determine which needs are unmet or discover segments of customers with unique sets of unmet needs.
- Context makes the irrational rational. For example, think of Snickers and Milky Way.
- “They're both candy bars, they're both bought in the checkout aisle, they're both made almost with the same ingredients, one has peanuts, one doesn't. And if you start to compare the products and do a competitive benchmark, you start to get to one's a little softer, one's a little harder, one's got a few more calories, one's got less calories. But when you talk to people about when's the last time they ate a Snickers, when time's the last time they ate a Milky Way, you start to realize that Snickers typically is a case where they missed the last meal, they've got a lot of work to do, they're running out of energy and they want to basically get back to the tasks as fast as possible. And so you start to realize that Snickers is about almost like a meal replacement and it's about the stomach is growling and things like that. And you start to realize that if they didn't have a Snickers, it competes with a protein drink, it competes with a Red Bull, a coffee. But a Milky Way typically is eaten after an emotional experience, could be positive, could be negative. It's usually eaten alone, and it's taking time to regroup after this emotional thing. And you start to realize that it competes with things like a glass of wine, a brownie, and to be honest, a run. And so when you start to realize that, jobs helps you see the true competitive set from what we call the demand side of the world as opposed to the competitive set from the supply side of the world, which is the technology or the underlying business model by how which we're making it. And so it allows you to actually see what customers really want as opposed to trying to figure out, how do we sell things to people?” — Bob Moesta
- “One of the lies I was told growing up was build it and they will come.” — Bob Moesta
- “Stop trying to sell people and just help them make progress, help them buy.” — Bob Moesta
- “There's the difference between what they say they want and what they want.” — Bob Moesta
- “I use the framework of pushes, pulls, anxieties and habits and say, "What caused them to do this?"” — Bob Moesta
- “I never trust anybody telling me things they're going to do because they can't assure it, and it usually never happens. Just because people bitch about something doesn't mean they're going to do anything about it....So for example, in the first five minutes of an interview, they're going to tell you, "I bought a new car because I got a deal on it and it was a car I've been dreaming about forever," and it's like they have all these things and then when you start to get to, it's like, no, the old car had 280,000 miles on it....The fact is it's making a sound and you've got a long trip coming up, that's why you're getting a car. You're not getting the car because of the deal. And so there's these, I call it the layers of language.” — Bob Moesta
- The value of value depends on where a client starting from and where they want to go. The value of an outcome is much more if you are starting all the way at the bottom as opposed to closer to the top.
- There are 3 levels of dimension of information/energy that needs to be retrieved from a job executor (customer/client/user):
- Functional Energy: The core part of their jobs that requires time, space, effort or knowledge.
- Emotional Energy: The emotional aspect of which is how I feel, I want to feel better, I feel frustrated, or I feel overlooked.
- Social Energy: The social aspect of how I want others to perceive me or how others perceive me.
- Understand the causation behind the client's job and then use design thinking to craft client enablement for people to make progress.
- Most people say, "If I just add more features, create more pull, people will buy." It's not true. More features create anxiety. Reduce friction and create make it easier for people to make progress.
- “People don’t want to buy a quarter-inch drill. They want a quarter-inch hole!” — Theodore Levitt
- “People buy products and services to get a job done”. — Clayton Christensen
- “One of the biggest misconceptions around Jobs to Be Done is this notion that it's pain and gain as opposed to context and outcome.” — Bob Moesta, Co-creator of the Jobs To Be Done (JTBD)
Further reading
Continuous Discovery
Product Manager's work: work that you do to decide what to build as discovery and the work that you do to build and ship a product as delivery.
There are 6 habits required for continuous discovery:
- Outcome-oriented. Focusing on outcome rather than output.
- Customer-centric. Really understanding your customers.
- Collaborative. Getting the right people involved in discovery.
- Visual. Using the opportunity solution tree, among other tools to map-out what you want to learn in discovery.
- Experimental. Making the process hypothesis-driven and learning all the time.
- Continuous. Making discovery an ongoing part of business-as-usual rather than a one-off activity.
Think in the structure of trees. It helps us deconstruct large, intractable problems into a series of smaller, more solvable problems. The value of breaking big opportunities into a series of smaller opportunities is twofold. First, it allows us to tackle problems that otherwise might seem unsolvable. Second, it allows us to deliver value over time. That second benefit is at the heart of the Agile manifesto and is a key tenet of continuous improvement.
The biggest barrier to testing assumptions is becoming aware of the assumptions we are making. sizes. As product trios, we are primarily concerned with assumptions in the following categories:
- Desirability assumptions: Does anyone want it? Will our customers get value from it?
- Viability assumptions: Should we build it?
- Feasibility assumptions: Can we build it?
- Usability assumptions: Is it usable? Can customers find what they need? Will
- Ethical assumptions: Is there any potential harm in building this idea? This is an area that is grossly underdeveloped for many product trios.
Here are a few other concepts from Teresa Torres.
Opportunity solution tree (OST): Opportunity solution trees are a simple way of visually representing the paths you might take to reach a desired outcome. The root of the tree is your desired outcome—the business need that reflects how your team can create business value. Opportunity solution trees help you resolve the tension between business needs and customer needs. As you embark on the wandering paths of discovery, your tree will act as your roadmap, helping you find the best path to your desired outcome.
Skipping “whether or not” decision is when we frame a problem as “Should we do this or not?” Instead of framing our decisions as “whether or not” decisions, develop a “compare and contrast” mindset. Instead of asking, “Should we solve this customer need?” we’ll ask, “Which of these customer needs is most important for us to address right now?” We’ll compare and contrast our options.
A business outcome (for example, retention) measures how well the business is progressing. A product outcome (for example, customers like your ice cream) measures how well the product is moving the business forward. A traction metric measures usage of a specific feature (for example, customers like the waffle cones) or workflow in the product.
Experience map: An experience map that reflects what you know about your customers’ experience today while answering outcome questions. Each individual comes up with their own visuals. Then the team combines all of their maps together. This shared map will guide your customer interviews, and it will help give structure to the opportunity space. It can and should evolve week over week as your team learns about your customers. Interview snapshot: An interview snapshot is a one-pager designed to help you synthesize what you learned in a single interview. It’s how you are going to turn your copious notes into actionable insights. Your collection of snapshots will act as a reference or index to the customer knowledge bank you are building through continuous interviewing.
Opportunity assessment: teams assess opportunities using the following criteria: opportunity sizing, market factors, company factors, and customer factors.
- Opportunity sizing helps us answer the questions: How many customers are affected and how often?
- Market factors help us evaluate how addressing each opportunity might affect our position in the market.
- Company factors help us evaluate the strategic impact of each opportunity for our company, business group, or team.
- Customer factors help us evaluate how important each opportunity is to our customers.
Business strategy
| Framework | Description |
|---|---|
| 7 Powers | 7 Powers is arguably the best business strategic framework which includes scale economics, switching costs, cornered resource, counter positioning, branding, network effects, and process. |
| Wardley Maps | They provide situational awareness and shared assumptions about a context necessary for building a sound strategy. It is a representation of the landscape in which a business operates. |
| Porter's Five Forces | A framework for determining the level of competition within an industry and evaluate a firm's strategic position: bargaining power of suppliers and buyers, the threat of new entrants or substitutes, and industry rivalry, make up the five forces. |
| The Lean Canvas | It lays out a clear process for defining and adjusting a business model based on customer development. |
7 Powers
Hamilton Helmer covers 7 powers that companies can leverage on:
- Scale Economies: A business in which per unit cost declines as production volume increases.
- Network Economies: A business in which the value realized by a customer increases as the installed base increases.
- Counter-Positioning: A newcomer adopts a new, superior business model which the incumbent does not mimic due to anticipated damage to their existing business.
- Switching Costs: The value loss expected by a customer that would be incurred from switching to an alternate supplier for additional purchases.
- Branding: The durable attribution of higher value to an objectively identical offering that arises from historical information about the seller.
- Cornered Resource: Preferential access at attractive terms to a coveted asset that can independently enhance value.
- Process Power: Embedded company organization and activity sets which enable lower costs and/or superior product, and which can be matched only by an extended commitment.
Further reading
Wardley Maps
They provide situational awareness and shared assumptions about a context necessary for building a sound strategy. It is a representation of the landscape in which a business operates.
- Simon Wardley, the technique’s inventor, describes strategy using Sun Tzu’s Five Factors:
- Purpose: A wise leader has a purpose (a what and a why). This is the force that compels you to do what you do and make what you make. It’s the higher reason for doing your work, often called your moral imperative.
- Landscape: A wise leader grasps the terrain because every organization operates within a landscape that represents the context for its decisions (leader has a map). This is the context: a mapping of the competitive environment in which you operate.
- Climate: A wise leader anticipates the patterns of the forces acting on the environment. There are always external forces manipulating the environment. In the same way that you don’t control the weather, you don’t control external forces like trends and the economy. But you can be aware of the climate and learn how best to prepare for it.
- Doctrine: A wise leader trains the organization in universally useful principles. Just as a religion has a core set of beliefs, your company will have a certain set of principles that will be applied to any situation.
- Leadership: A wise leader makes shrewd decisions that lead to victory. This is the strategy that you’ll determine after you consider your purpose, landscape, and climate.
- It consists of a value chain (activities needed to fulfill user needs) graphed against evolution (how individual activities change over time under supply and demand competition).
- In Wardley Maps, the y-axis (vertical) represents visibility to the user. Like a traditional value chain, the higher the component, the more the user can see it. For example, a web page might be at the top, while a database or a server might be near the bottom. The x-axis (horizontal) contains the four stages of evolution:
- I. Genesis: The object is rare, poorly understood, and uncertain. There is the potential to have high future worth. The object is described with wonder, and it’s different from anything else in the market in this context. It should be a competitive advantage and experimentation is rife.
- II. Custom Built: More people are starting to consume and understand the object. The market is forming, and there is potential ROI. As understanding increases, users start to find its value, but inconsistently. The key focus is learning.
- III. Product Rental: Consumption is rapidly increasing as the market grows. The object is profitable, new features can differentiate it, and there is a refinement of needs. Things are starting to get competitive, and the profit margins mean it’s a crowded market.
- IV. Commodity/Utility: The object is widespread and stabilizing. It’s a mature and ordered market. The high volume has decreased margins. Operational efficiency is king, and failure is not tolerated in the market. This is the cost of doing business (like oil & gas).
Further reading
Porter's Five Forces
It is not a boring business exercise. It helped the founders of Warby Parker create a company worth over $1B. Their analysis showed that the eyewear industry is dominated by a single player, Luxottica, which kept prices of prescription glasses artificially high. A pair was priced at around $300 even though it cost only $10-$20 to produce. The best framework for industry analysis is Porter’s Five Forces. It evaluates five competitive forces, which influence industry attractiveness. The basic idea is that your product or company is not competing just with direct competitors but with everyone in the ecosystem, including customers, suppliers, substitutes, and new entrants. For example, you might have very few competitors but you still can’t make any profit because your suppliers have more negotiating power and so they capture most of the profits.
Overview of Porter’s Five Forces:
- Threat of new entrants: How hard is it to enter an industry?
- Bargaining power of buyers: How easily can buyers drive our prices down? How well can they negotiate?
- Threat of substitutes: How else can customers satisfy the same need?
- Bargaining power of suppliers: how easily can suppliers drive their prices up? How well can they negotiate?
- Rivalry amongst existing competitors: How many competitors are in an industry? How strong are they?
The essence of strategy is choosing what not to do. — Michael Porter
Strategy is about making choices, trade-offs; it's about deliberately choosing to be different. — Michael Porter
The Lean Canvas
The Lean Canvas is a one-page visual business plan that's ongoing and actionable. It was created by Ash Maurya, and inspired by Alex Osterwalder's Business Model Canvas. It is fantastic at identifying the areas of biggest risk and enforcing intellectual honesty.
- Problem: List your topi 1-3 problems. Assess existing alternatives. List how these problems are solved today. Have you identified real problems people know they have?
- Customer segments: List your target customers and users. Assess early adopters. List the characteristics of your ideal customers. Do you know your target markets? Do you know how to target markets? Do you know how to target messages to them as distinct groups?
- Unique value proposition: Single, clear compelling message that turns an unaware visitor into an interested prospect. Produce a high level concept. List your X for Y analogy. For example, YouTube = Flickr for videos. Have you found a clear, distinctive, memorable way to explain why you are better or different?
- Solution: Outline a possible solution for each problem. Can you solve the problem in a right way?
- Channels: List your path to customers. How will you get your product or service to your customers, and their money back to you?
- Revenue streams: List your source of revenue. Where will the money come from? Will it be one-time or recurring? The result of a direct transaction (e.g., buying a meal) or something indirect (magazine subscriptions)?
- Cost structure: List your fixed and variable costs. What are the direct, variable, and indirect costs you'll have to pay for when you run the business?
- Metrics: List the key numbers that tell you how your business is doing. Do you know what numbers to track to understand if you are making progress?
- Unfair advantage: Something that cannot be easily copied or bought. What is the “force multiplier” that will make your efforts have greater impact than your competitors?
Analytics
| Framework | Description |
|---|---|
| Analytics Maturity Model | AMM—analytics maturity model is a sequence of steps or stages that represent the organization's evolution in leveraging data to inform business decisions. |
| Google HEART | It offers five metrics to monitor the user experience—happiness, engagement, adoption, retention and task success. |
| AARRR Pirate Metrics | A venture capitalist Dave McClure coined Pirate Metrics which categorizes the user metrics into AARRR—acquisition, activation, retention, revenue and referral. |
| The Three Engines of SaaS Growth | In The Lean Startup Eric Ries identified the three drivers of business growth: viral, sticky and paid. |
| Lean Canvas Metrics | Lean Canvas is an adaptation of Business Model Canvas by Alexander Osterwalder which Ash Maurya created in the Lean Startup spirit (Fast, Concise and Effective startup). For each lean canvas box, there are relevant metrics associated to it. |
| The Lean Gates of Analytics | The analytics framework presented in Lean Analytics based on empathy, stickiness, virality, revenue and scale. |
Analytics Maturity Model
AMM—analytics maturity model is a sequence of steps or stages that represent the organization's evolution in leveraging data to inform business decisions. The maturity model gives context to where you are in the process and the stages ahead. There are 6 stages of the analytics maturity model and the beginning two stages are part of a starting point foundation. The stages of the analytics maturity model should build on each other, not replace each other.
Backward-looking stages—focusing on what the historical data shows already happened.
- Foundational
- Companies that are in this stage are transitioning from no analytics to prioritize and understand what data they have and where it resides.
- Companies rely on this information, combined with benchmark data to make business decisions about how they might need to course correct or continue in a positive direction.
- Organizations start to ask questions such as:
- What information do I need to make better business decisions?
- How can I obtain that information?
- Descriptive
- Data and reports in this stage answer the question “What happened?”.
- How many quotes did we create?
- How many of those quotes converted to sales?
- How much revenue came from those sales?
- Data and reports in this stage answer the question “What happened?”.
- Diagnostic
- This stage answers the question “Why did it happen?” to better understand the reason something happened the way it did.
- How many quotes did we create compared to this time last year?
- How did we convert quotes to sales by region?
- Which regions had better or worse conversion rates?
- How have our prices changed this year compared to last year?
- These diagnostic questions build upon the descriptive questions. They go one level deeper, focusing not on the outcome, but instead on understanding if that outcome should have been expected, or if not, why not. This stage looks for the factors that can explain why a certain outcome happened.
- This stage answers the question “Why did it happen?” to better understand the reason something happened the way it did.
Forward-looking stages—focusing on predictive business mindset transitioning from reactive approach to proactive approach.
- Predictive
- Questions in this stage are proactive. They focus on what is likely to happen next. Based on the information companies gather in stages two and three, here are some examples questions that can start to emerge:
- What is our expected conversion rate next month by region?
- Are we likely to meet our revenue budget this year based on early performance?
- At this stage, the analytics maturity model transitions to a forward-looking perspective, moving from a reactive approach to a proactive and predictive business mindset.
- This mindset enables stakeholders to have an idea of where the business is headed, based on the data they do have.
- Questions in this stage are proactive. They focus on what is likely to happen next. Based on the information companies gather in stages two and three, here are some examples questions that can start to emerge:
- Prescriptive
- Building on the predictive questions, this stage focuses on what decisions can be made to influence the future – how can we make something happen? The goal is to find the best course of action for a given situation.
- How would having more sales reps affect our conversion rate?
- How would adjusting our prices affect the expected revenue next month?
- Moving to this stage in the model helps business leaders start considering what changes need to be made to move the business in the right direction by leveraging foundational analytics, simulations, or even artificial intelligence for decision support and perspective.
- Variable-driven, what-if style analysis can start to guide stakeholder understanding of where the company is to instead what they can do to affect the future and make more confident decisions.
- Building on the predictive questions, this stage focuses on what decisions can be made to influence the future – how can we make something happen? The goal is to find the best course of action for a given situation.
- Cognitive
- In this stage, companies begin utilizing machine learning and natural language processing to simulate human thought.
- The goal is to learn from data in real-time and with analytical agility at significant data scale.
- With a variety of approaches such as real-time data mining, pattern recognition, and natural language processing as just a few examples, organizations can identify unexpected, important, and influential patterns in large quantities of data across disparate sources.
- Companies that benefit most from this stage have discipline and a strong foundation in the previous 5 stages and have precise processes in place to gather and store data, often in a central data lake or warehouse, as well as strong cross-platform data analytics adoption.
Google HEART
The HEART metrics framework can help you share the results with stakeholders in a way that will build empathy for users and provide insight to make data-driven and user-centric decisions. It will supply the metrics you need to prioritize a long-delayed UI for a complex application.
Google applies three criteria to each HEART Metric: Goal, Signals, and Metrics. The criteria ranges from the qualitative to the quantitative.
- A Goal is a high-level description of what you want to achieve.
- Signals indicate what you can measure as you work toward your Goal.
- Metrics include concrete data that can show your progress.
Here is more on the five metrics:
- Happiness: Happiness is the state of being happy, which varies based on individual user attitudes. It’s relative and hard to quantify. In the HEART framework, Happiness is measured with user surveys.
- Engagement: Engagement captures the user’s involvement. For consumer-facing web applications, the user equates to the person who logged into the application. This is not as straightforward for enterprise applications. Ask yourself:
- Did a human perform an action, like create a new record?
- Did an application use your application to communicate with another application? Did it read or write data?
- Adoption and Retention: Adoption looks at new users while Retention tracks the longevity of all users. Adoption and Retention metrics can be used to provide stronger insight into counts of the number of unique users in a given time period (e.g. seven-day active users), addressing the problem of distinguishing new users from existing users. Adoption metrics track how many new users start using a product during a given time period (for example, the number of accounts created in the last seven days), and Retention metrics track how many of the users from a given time period are still present in some later time period (for example, the percentage of seven-day active users in a given week who are still seven-day active three months later). What counts as "using" a product can vary depending on its nature and goals.
- Task Success: This category encompasses several traditional behavioral metrics of user experience, such as efficiency (e.g. time to complete a task), effectiveness (e.g. percent of tasks completed), and error rate. One way to measure these on a large scale is via a remote usability or benchmarking study, where users can be assigned specific tasks. With web server log file data, it can be difficult to know which task the user was trying to accomplish, depending on the nature of the site. If an optimal path exists for a particular task (e.g. a multi-step sign-up process) it is possible to measure how closely users follow it
Further reading
AARRR Pirate Metrics
AARRR Pirate Metrics framework is an acronym for a set of five user-behavior metrics that product-led growth businesses should be tracking: acquisition, activation, retention, referral, and revenue.
- Acquisition: How are people discovering your product or company?
- Function: Generate attention through a variety of means, both organic and inorganic
- Relevant Metrics: Traffic, mentions, cost per click, search results, cost of acquisition, open rate
- Activation: Are these people taking the actions you want them to?
- Function: Turn the resulting drive-by visitors into users who are somehow enrolled
- Relevant Metrics: Enrollments, sign-ups, completed onboarding process, used the service at least once, subscriptions
- Retention: Are your activated users continuing to engage with the product?
- Function: Convince users to come back repeatedly, exhibiting sticky behavior
- Relevant Metrics: Engagement, time since last visit, daily and monthly active use, churns
- Revenue: Are your personas willing to pay for this product?
- Function: Business outcomes which vary based on business model— purchases, ad clicks, content creation, subscription, etc
- Relevant Metrics: Customer lifetime value, conversion rate, shopping cart size, click-through revenue
- Referral: Do users like the product enough to tell others about it?
- Function: Viral and word-of-mouth invitations to other potential users
- Relevant Metrics: Invitation sent, viral coefficient, viral cycle time
Further reading
The Three Engines of SaaS Growth
In The Lean Startup Eric Ries identified the three drivers of business growth: viral, sticky and paid. While each of these can drive growth for your company, it’s important to choose the most relevant one for your service offering and business strategy.
- The Sticky Engine of Growth: If you’re focused on retaining customers for the long term, this is the engine you need to focus on. Maintaining a low customer attrition is absolutely critical. You need to do everything you can to keep your customers coming back month after month. Once you have an exceptionally low attrition rate, you only need to acquire a few new customers to keep your business growing. Before focusing on finding new customers, focus on your current ones. The fundamental KPI for stickiness are:
- Customer Retention
- Churn Rates
- Usage Frequency
- Time Since Last Visit
- The Viral Engine of Growth: This is the domain of word of mouth and having your product advertise itself. Either by telling their friends or simply using your product, your customers will do your advertising for you. The most critical element of this engine is making sure the every customer brings more than one friend to your business. If 10 of your customers bring 11 of their friends to you, your business will grow rapidly. Because those 11 will bring 11 (or 12) of their friends. Every group will be bigger than the last and you’ll get compounding growth. Be careful about relying on this engine of growth, it’s incredibly difficult to build intentionally. For you to rely on viral marketing, your product needs to be absolutely incredible and fit your target market perfectly. If everything isn’t perfect, the viral loop will hit a dead end and you’ll run out of customers without other marketing. The key metric for this engine is:
- Viral Coefficient (the number of new users each user brings on)
- Viral Cycle Time (the speed with which a user invites another)
- The Paid Engine of Growth: This is what most business owners are familiar with and every form of advertising falls into this category. Whether you’re using the yellow pages or Super Bowel ads, you’re buying your customers. When operating on this engine, each customer needs to give you a profit. If you’re spending a $1.00 to acquire a customer, you better be making enough to cover the $1.00, your other expenses, and leave a bit of profit left over. As long as you’re making a profit on each customer, you can invest those profits into more advertising to accelerate growth. Purchasing ads, employing sales teams, and leasing expensive real estate for foot traffic are all examples of the paid engine of growth. Make sure your costs are covered. The key metrics are:
- Customer Lifetime Value (CLV)
- Customer Acquisition Cost (CAC)
- Time to Customer Breakeven
Further reading
Lean Canvas Metrics
Following are relevant metrics for each one of the lean canvas box:
- Problem: Respondents who have this need, respondents who are aware of having the need
- Solution: Respondents who try the MVP, engagement, churn, most-used/least-used features, people willing to pay
- Unique Value Proposition: Feedback scores, independent ratings, sentiment analysis, customer-worded descriptions, surveys, search and competitive analysis
- Customer Segments: How easy it is to find groups of prospects, unique key-word segments, targeted funnel traffic from a particular source
- Channels: Leads and customers per channel, viral coefficient, viral cycle, net promoter score, open rate, affiliate margins, click-through rate, page rank, message reach
- Unfair Advantage: Respondents' understanding of UVP (unique value proposition), patents, brand equity, barriers to entry, number of new entrants, exclusivity of relationships
- Revenue Streams: Lifetime customer value, average revenue per user, conversion rate, shopping cart size, click through-rate
- Cost Structure: Fixed costs, cost of customer acquisition, cost of servicing the nth customer, support costs, keyword costs
The Lean Gates of Analytics
The analytics framework presented in Lean Analytics takes many of the stages in the four frameworks—Dave McClure’s AARRR Pirate Metrics, Ash Marya’s Lean Canvas, Sean Ellis’s, Startup Growth Pyramid and The Long Funnel— combines them into a single framework with five stages:
- Empathy — You’re looking for a real, poorly-met need that can be found in a reachable market. Once you do so, you’re figuring out how to solve their problem in a way customers will accept and pay for.
- Stickiness — You’re looking for the right mix of products/features/functionality that will keep users around.
- Virality — You’re looking for ways to fuel growth organically and artificially.
- Revenue — You’re looking for a scalable and sustainable business with the right margins in a healthy ecosystem.
- Scale — You’re looking to scale up the business on all fronts.
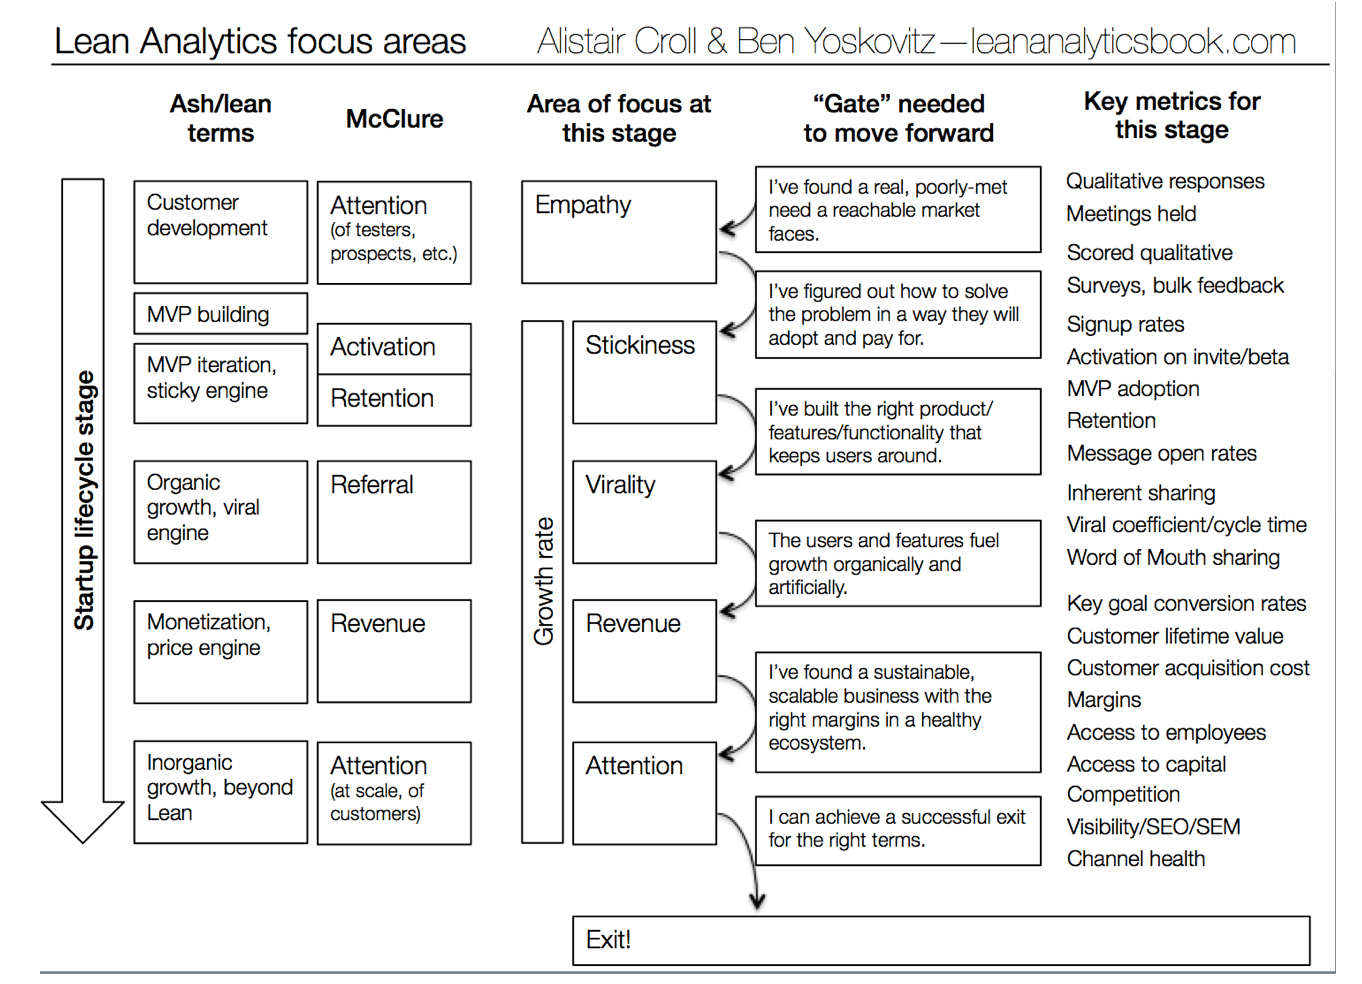
Source: https://leananalyticsbook.com/the-lean-gates-of-analytics/